How to Calculate Average: Formula, Examples & Free Calculator (2026)
Last Updated: June 2026 Reviewed By: CalcyLab Editorial Team Reading Time: ~14 minutes Educational Disclaimer: This article is for educational purposes only. Always verify critical calculations with a qualified professional.
How to Calculate Average: Formula, Examples & Free Calculator (2026)
Whether you’re a student trying to find your test score average, a professional tracking monthly sales figures, or an investor averaging down on a stock position, knowing how to calculate average is a foundational math skill used every single day.
This guide covers everything — the basic average formula, step-by-step examples, weighted averages, moving averages, and common mistakes. Skip the confusion. By the end of this page, you’ll be able to calculate the average of any set of numbers with confidence.
And if you’d rather let the tool do the work? Use CalcyLab’s free Average Calculator — instant results, no sign-up needed.
What Is an Average?
An average is a single number that represents a collection of numbers. It answers the question: “What is the typical or central value in this data set?”
In everyday language, average is used loosely — a “below average” salary, “average” weather, “above average” scores. In mathematics, the word average almost always refers to the arithmetic mean: the result you get when you add up all your values and divide by how many there are.
Averages are useful because they compress a large amount of information into one digestible number. Instead of listing every student’s score, you can say the class averaged 74%. Instead of reporting every daily temperature, a weather service reports the monthly average.
There are other types of averages — median, mode, weighted mean — and we’ll cover all of them. But the arithmetic mean is where everyone starts.
The Average Formula Explained
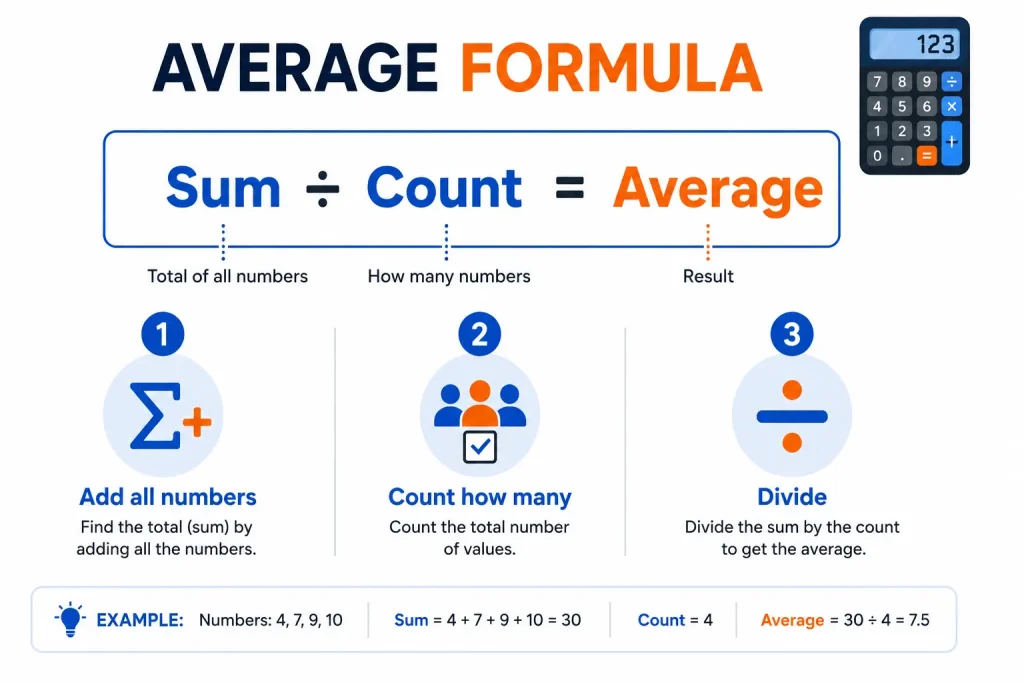
The average formula is straightforward:
Average = Sum of All Values ÷ Number of Values
In mathematical notation:
x̄ = (x₁ + x₂ + x₃ + ... + xₙ) / n
Where:
- x̄ (pronounced “x-bar”) = the average (arithmetic mean)
- x₁, x₂, … xₙ = each individual value in the data set
- n = the total count of values
This formula works for any set of numbers — test scores, temperatures, prices, weights, or any other measurable quantity.
How to Calculate Average: Step by Step
Follow these three steps every time:
Step 1 — List all your numbers. Write out every value you want to include in the calculation. Don’t skip any, and don’t add values that shouldn’t be there.
Step 2 — Add them all together. Find the sum (total) of all values in the list.
Step 3 — Divide by the count. Take that total and divide it by how many numbers you have.
The result is your average.
Simple Average Examples
Example 1: Average of Three Numbers
Find the average of 10, 20, and 30.
- Sum: 10 + 20 + 30 = 60
- Count: 3
- Average: 60 ÷ 3 = 20
Example 2: Average of Five Numbers
Find the average of 45, 82, 67, 91, and 55.
- Sum: 45 + 82 + 67 + 91 + 55 = 340
- Count: 5
- Average: 340 ÷ 5 = 68
Average of Two Numbers
The average of two numbers is simply the midpoint between them — the value exactly halfway between the two.
Formula:
Average of 2 numbers = (a + b) / 2
Example: Average of 36 and 84
- Sum: 36 + 84 = 120
- Divide by 2: 120 ÷ 2 = 60
This is also called the arithmetic mean of two numbers, and it’s the concept behind midpoints on number lines, salary negotiations (“let’s split the difference”), and price benchmarking.
Average of Multiple Numbers
The same formula scales to any number of values. The more data points you have, the more meaningful and stable your average tends to be.
Example: Average monthly rainfall (mm) across 6 months
| Month | Rainfall (mm) |
|---|---|
| January | 42 |
| February | 37 |
| March | 58 |
| April | 71 |
| May | 63 |
| June | 49 |
- Sum: 42 + 37 + 58 + 71 + 63 + 49 = 320
- Count: 6
- Average: 320 ÷ 6 = 53.33 mm
Use CalcyLab’s online average calculator to handle large lists of numbers instantly — just paste or type your values and get the result.
Weighted Average Formula
A weighted average assigns different levels of importance (weights) to different values. Not every number in a data set deserves equal influence.
When to use it:
- GPA calculations (different courses carry different credit hours)
- Investment portfolios (positions of different sizes)
- Employee performance reviews (some metrics matter more)
- Final exam grades (the final is worth more than a quiz)
Weighted Average Formula:
Weighted Average = (w₁x₁ + w₂x₂ + ... + wₙxₙ) / (w₁ + w₂ + ... + wₙ)
Where w = weight and x = value.
Example: Student GPA
| Subject | Score | Credit Hours (Weight) |
|---|---|---|
| Math | 85 | 4 |
| English | 78 | 3 |
| History | 92 | 2 |
| Art | 70 | 1 |
- Numerator: (85×4) + (78×3) + (92×2) + (70×1) = 340 + 234 + 184 + 70 = 828
- Denominator: 4 + 3 + 2 + 1 = 10
- Weighted Average: 828 ÷ 10 = 82.8
A simple (unweighted) average of the four scores would give 81.25 — a slightly different result because it ignores the fact that Math carries more weight.
Running Average (Cumulative Average)
A running average (also called cumulative average) updates every time a new data point is added, without discarding older data. It reflects the average of all data collected up to that point.
Formula:
New Running Average = (Previous Average × n + New Value) / (n + 1)
Example: A salesperson’s daily sales:
- Day 1: $500 → Running avg: $500
- Day 2: $700 → Running avg: (500 + 700) / 2 = $600
- Day 3: $600 → Running avg: (500 + 700 + 600) / 3 = $600
- Day 4: $800 → Running avg: (500 + 700 + 600 + 800) / 4 = $650
Running averages are commonly used in customer satisfaction tracking, athletic performance monitoring, and daily step-count summaries in fitness apps.
Moving Average (Rolling Average)
A moving average keeps the window of observation fixed and slides forward as new data comes in, dropping the oldest point each time. Unlike a running average, it doesn’t accumulate indefinitely.
Example: 3-day moving average of temperatures (°C)
| Day | Temp | 3-Day Moving Avg |
|---|---|---|
| 1 | 22 | — |
| 2 | 25 | — |
| 3 | 24 | (22+25+24)/3 = 23.7 |
| 4 | 27 | (25+24+27)/3 = 25.3 |
| 5 | 23 | (24+27+23)/3 = 24.7 |
| 6 | 26 | (27+23+26)/3 = 25.3 |
Moving averages are widely used in stock market analysis to smooth out price volatility and reveal underlying trends. The 50-day and 200-day moving averages are among the most-watched indicators in investing.
Mean vs Median vs Mode
These three are all types of averages, but they measure different things:
| Measure | Definition | Best Used When |
|---|---|---|
| Mean | Sum ÷ Count | Data is evenly distributed, no extreme outliers |
| Median | Middle value when sorted | Data has outliers (e.g., income, home prices) |
| Mode | Most frequently occurring value | Categorical data or finding common trends |
Example using the same data set: {3, 5, 5, 7, 100}
- Mean: (3+5+5+7+100) / 5 = 24 (skewed by 100)
- Median: 5 (the middle value — more representative here)
- Mode: 5 (appears twice)
The mean is the most common average, but it can be misleading when extreme values (outliers) exist. A neighborhood with four $200,000 homes and one $5,000,000 mansion has a mean home price of about $1.08 million — a figure that doesn’t represent any actual home.
Average in Excel
Excel calculates averages in seconds. Here are the formulas you need:
Simple Average:
=AVERAGE(A1:A10)
Calculates the mean of all numbers in cells A1 through A10. Excel ignores blank cells and text — but it counts zeros.
Average with a Condition (AVERAGEIF):
=AVERAGEIF(B1:B10, ">50", C1:C10)
Averages values in column C only where the corresponding value in column B exceeds 50.
Average with Multiple Conditions (AVERAGEIFS):
=AVERAGEIFS(C1:C10, B1:B10, ">50", D1:D10, "Approved")
Weighted Average (using SUMPRODUCT):
=SUMPRODUCT(B2:B5, C2:C5) / SUM(C2:C5)
Multiplies each value by its weight, sums the result, then divides by total weight.
Quick tip: You can see the average instantly in Excel’s status bar (bottom of screen) by highlighting a range of cells — no formula needed.
Average in Statistics
In statistics, the arithmetic mean is part of a broader family of concepts:
Population Mean (μ): The average of an entire population.
μ = Σx / N
Sample Mean (x̄): The average of a sample taken from a population.
x̄ = Σx / n
The distinction matters in research. If you surveyed every person in a country about their income, you’d calculate the population mean. If you surveyed 1,000 people as a representative sample, you’d calculate the sample mean — which estimates the population mean with some margin of error.
Statistics also uses the mean alongside standard deviation to describe how spread out data is. A class where everyone scored between 70–80% has the same mean as a class with scores ranging from 20–100%, but a very different story.
Average Percentage Formula
Averaging percentages is a common need — for grades, surveys, conversion rates, and more. The formula is the same as for regular numbers.
Example: Average score across 4 tests
| Test | Score |
|---|---|
| Test 1 | 78% |
| Test 2 | 85% |
| Test 3 | 72% |
| Test 4 | 91% |
- Sum: 78 + 85 + 72 + 91 = 326
- Count: 4
- Average: 326 ÷ 4 = 81.5%
Important caveat: Averaging percentages only works correctly when each percentage is based on an equal sample size. If Test 1 was out of 50 marks and Test 4 was out of 200, a simple average of the percentages is misleading. In that case, use a weighted average based on total marks available.
Need to work with percentages more broadly? Try CalcyLab’s Percentage Calculator for quick percentage calculations.
Average Marks Calculation
Calculating the average of exam scores is one of the most common uses of the average formula — for students, teachers, and parents alike.
Example: Student’s marks across 6 subjects
| Subject | Marks Obtained | Total Marks |
|---|---|---|
| Math | 87 | 100 |
| Science | 76 | 100 |
| English | 82 | 100 |
| History | 69 | 100 |
| Geography | 91 | 100 |
| Computer | 78 | 100 |
- Total marks obtained: 87 + 76 + 82 + 69 + 91 + 78 = 483
- Total possible marks: 600
- Average percentage: (483 / 600) × 100 = 80.5%
For GPA calculations — which use a weighted average of grade points — see CalcyLab’s full guide on GPA vs CGPA.
Average in Finance
Finance is saturated with averages. Understanding them helps you make smarter money decisions.
Average Cost (Dollar-Cost Averaging): When you invest a fixed amount regularly, your average cost per share changes with the market. If you bought 10 shares at $50 and 10 more at $30, your average cost is ($500 + $300) / 20 = $40 per share.
Average Revenue: Total revenue divided by the number of units sold gives Average Revenue (AR) — a key indicator of pricing power.
Average Return: Used in investing to assess historical performance. A fund that returned 12%, -5%, 8%, and 15% over four years has a simple average return of (12 – 5 + 8 + 15) / 4 = 7.5% per year.
Average in Stock Investing
Stock investors use averages constantly — particularly when managing position sizes after a price drop.
Stock Averaging Down: If you bought 100 shares at $80 and later bought 100 more at $60, your average price is:
- Total cost: (100 × $80) + (100 × $60) = $8,000 + $6,000 = $14,000
- Total shares: 200
- Average cost: $14,000 / 200 = $70 per share
This is especially useful when you believe in a company long-term but bought in at a high price. By purchasing more at a lower price, you bring down your break-even point.
Use CalcyLab’s dedicated Stock Average Calculator to calculate your average share price across multiple buy orders instantly.
Moving Averages in Trading: Traders use the 50-day and 200-day simple moving averages (SMA) as trend indicators. When the 50-day SMA crosses above the 200-day SMA — the “golden cross” — it’s often interpreted as a bullish signal. The opposite crossing is called a “death cross.”
Average in Data Analysis
Data analysts use averages as one of the first steps in exploring any dataset. But they also know when NOT to use them.
When averages work well: Normally distributed data where values cluster around a center point. Test scores, height measurements, production times.
When averages mislead: Skewed data with long tails. Income distributions, housing prices, app session lengths — these are often better described by the median.
Running Averages in Analytics: Web analytics platforms (Google Analytics, Mixpanel) show rolling 7-day and 30-day averages for traffic, conversion rates, and engagement — smoothing out the day-to-day noise so you can see the real trend.
Z-Scores and the Mean: In data analysis, a z-score measures how many standard deviations a value lies from the mean. It uses the average as its anchor, making the mean foundational to almost all statistical analysis.
Common Average Mistakes
Even simple math can go wrong. Here are the errors people make most often:
1. Averaging percentages from groups of different sizes. You can’t just average “40% female employees in Team A” with “60% female employees in Team B” if Team A has 10 people and Team B has 100 people. Weight the percentages by group size.
2. Including zeros when they shouldn’t be there. If a student missed a test and gets a 0, including that 0 in the average is accurate — but if the 0 represents missing data rather than a genuine score, it distorts the result.
3. Confusing mean with median. Reporting the “average” income in a city when the data includes billionaires will produce an inflated number. Median is often more informative for skewed data.
4. Rounding intermediate values. Always carry full decimal places through your calculation. Only round at the very end.
5. Dividing by the wrong count. If you have 10 numbers but one represents an absence or error and you exclude it, make sure your denominator is 9, not 10.
Real-Life Uses of Average
Averages aren’t just classroom math — they’re embedded into decisions you encounter daily:
- Weather reporting: Daily, monthly, and annual average temperatures and rainfall
- Sports statistics: Batting averages, points per game, goals per match
- Healthcare: Average blood pressure readings over time, average recovery time
- Education: Class average, GPA, percentile rankings
- Business: Average order value, average customer lifetime value, average handling time
- Economics: GDP per capita (average output per person), average wage
- Investing: Average cost basis, moving averages on charts
- Fitness: Average heart rate, average pace per kilometer
How an Average Calculator Works
An online average calculator (like the one at CalcyLab) automates the three-step process:
- You input a set of numbers — separated by commas, spaces, or new lines
- The calculator sums all values and counts how many you entered
- It divides and returns the result instantly
A good average calculator also shows you the sum, count, minimum, maximum, and sometimes the median and mode alongside the mean — giving you a complete statistical picture, not just one number.
CalcyLab’s Average Calculator handles any number of inputs, works on mobile and desktop, and requires no account or download.
Conclusion
Knowing how to calculate average — from the basic arithmetic mean to weighted averages, moving averages, and their applications in school, finance, and data analysis — gives you a practical tool for making sense of numbers in the real world.
The formula itself is simple: Sum ÷ Count. What takes knowledge is knowing which type of average to use, when a simple mean is sufficient, and when other measures like the median or weighted average tell a truer story.
When you need a quick answer, skip the mental math and use CalcyLab’s free Average Calculator. Need to work with percentages? The Percentage Calculator has you covered. Tracking your stock positions? The Stock Average Calculator does the heavy lifting.
═══════════════════════════════════════════════
FAQs
═══════════════════════════════════════════════
Q1: What is the average formula? The average formula is: Average = Sum of all values ÷ Number of values. In symbols, x̄ = Σx / n. Add every number in your data set together, then divide that total by how many numbers there are. The result is the arithmetic mean, which is what people usually mean when they say “average.”
Q2: How do I calculate average step by step? Step 1 — Write down all the numbers you want to average. Step 2 — Add them all together to find the sum. Step 3 — Count how many numbers you have. Step 4 — Divide the sum by the count. That final number is your average.
Q3: What is the average of 2 numbers? Add the two numbers together and divide by 2. For example, the average of 40 and 60 is (40 + 60) / 2 = 50. This is also called the arithmetic mean or midpoint of the two values.
Q4: How do I find the average of percentages? You can average percentages the same way as regular numbers — add them up and divide by the count — but only when each percentage is based on the same sample size. If the sample sizes differ (e.g., different class sizes or different test totals), you must use a weighted average based on the actual totals to get an accurate result.
Q5: What is a weighted average and how is it different from a simple average? A simple average treats all values equally. A weighted average assigns different levels of importance (weights) to different values. For example, if a final exam counts for 50% of your grade and quizzes only 10%, you use a weighted average to calculate your final score. The formula is: Weighted Average = Σ(value × weight) / Σweights.
Q6: How do I calculate average marks in school? Add up all the marks you scored across your subjects. Divide that total by the number of subjects. If you scored 80, 75, 90, and 65 across four subjects, your average mark is (80 + 75 + 90 + 65) / 4 = 77.5. For GPA, which is a weighted average based on credit hours, the calculation is slightly different — see CalcyLab’s GPA vs CGPA guide.
Q7: What is a running average vs a moving average? A running average (cumulative average) includes all data points collected so far — the window keeps growing. A moving average uses a fixed window size that shifts forward with each new data point, dropping the oldest value as a new one is added. Running averages work well for tracking overall trends; moving averages work better for recent trend analysis, such as in stock price analysis.
Q8: How do I calculate a 3-day moving average? Take any three consecutive days’ values, add them up, and divide by 3. When the next day’s data arrives, drop the first day, include the new day, and calculate the average of the new three-day window. For example, with values 10, 12, 14, 16, 18: the 3-day moving averages would be 12, 14, and 16.
Q9: What does “average” mean in statistics? In statistics, average usually refers to the arithmetic mean — the sum divided by count. But statisticians also use the median (middle value) and mode (most common value) as measures of central tendency. When a statistician says “average,” they often specify which one to avoid ambiguity. The mean is ideal for symmetric, normally distributed data; the median is preferred for skewed distributions.
Q10: Why is the median sometimes better than the mean? The mean is sensitive to extreme values (outliers). One very high or very low number can pull the mean far from what’s “typical.” The median — the exact middle value when data is sorted — is unaffected by outliers. This is why income statistics almost always report median household income rather than mean income. A single billionaire in your data set can dramatically inflate the mean while the median remains stable.
Q11: How do I calculate the average in Excel? Type =AVERAGE( and then select the range of cells you want to average, then close the bracket and press Enter. For example, =AVERAGE(A1:A20) gives the mean of 20 values. You can also highlight a range and look at the status bar at the bottom of the screen — Excel displays the average there automatically without needing a formula.
Q12: What is the average formula for percentage increase? To find an average percentage increase over multiple periods, add all the percentage changes together and divide by the number of periods. For example, if revenue grew 10%, 5%, and 15% over three years, the average annual growth is (10 + 5 + 15) / 3 = 10%. For compound growth, use the CAGR (Compound Annual Growth Rate) formula instead, which accounts for compounding effects.
Q13: How is average used in investing? Investors use averages in several ways. Dollar-cost averaging involves investing a fixed amount regularly to reduce the impact of market volatility on the average purchase price. Investors who buy the same stock at different prices calculate their average cost basis to determine profitability. Technical traders use 50-day and 200-day moving averages to identify market trends and potential buy/sell signals.
Q14: What is the difference between arithmetic mean and geometric mean? The arithmetic mean is the standard average — sum divided by count. The geometric mean is found by multiplying all values together and then taking the nth root (where n is the count of values). The geometric mean is more appropriate for data that represents growth rates or ratios. For example, if an investment grew 50% one year and fell 50% the next, the arithmetic mean is 0% — suggesting no change — but the geometric mean correctly shows a net loss, because 1.5 × 0.5 = 0.75 (a 25% loss overall).
Q15: Can the average be a decimal number? Yes, absolutely. The average of a set of whole numbers often produces a decimal result. For example, the average of 1, 2, and 3 is (1 + 2 + 3) / 3 = 2 exactly, but the average of 1, 2, and 4 is 7/3 = 2.333… Decimals in averages are completely normal and should not be rounded unless you have a specific reason to do so.
Q16: What is the average formula for speed? Average speed = Total distance ÷ Total time. For example, if you drove 300 km in 4 hours, your average speed was 75 km/h. Note that this is not the same as averaging individual speeds — if you drove at 60 km/h for 2 hours and 90 km/h for 2 hours, the simple average of speeds (75 km/h) happens to match, but this only holds when time intervals are equal. When distances are equal but times differ, use the harmonic mean of the speeds.
Q17: How do you find the average of negative numbers? Exactly the same way as with positive numbers. Add all values (including negatives) together, which may reduce the total, then divide by the count. For example, the average of -10, 5, -3, and 8 is (-10 + 5 + (-3) + 8) / 4 = 0 / 4 = 0. Negative numbers are just values below zero — the formula doesn’t change.
Q18: How does a weighted average work for GPA? GPA is a weighted average where the weight is the number of credit hours each course carries. Multiply each course’s grade point (on the 4.0 scale) by its credit hours, sum all those products, then divide by the total credit hours. A 3-credit-hour A (4.0) contributes 12 points, while a 1-credit-hour B (3.0) contributes only 3 points, so heavier courses have more influence on the final GPA.
Q19: What is an average calculator online and how does it work? An online average calculator is a tool where you enter a list of numbers and it instantly calculates their arithmetic mean. Better tools also return the sum, count, minimum, maximum, range, and sometimes the median and mode. CalcyLab’s average calculator accepts any number of inputs — just type or paste them in, separated by commas or spaces, and the result appears immediately. There’s nothing to install and no account required.
Q20: Is the mean always the best measure of average? Not always. The mean is ideal for symmetric distributions where no extreme values are present — like heights in a population or standardized test scores. But for skewed data sets with outliers (income, home prices, response times), the median is often a more honest representation of the “typical” value. For categorical data — like most popular shoe size or most common blood type — the mode is the appropriate measure. A skilled analyst knows which type of average to choose based on the nature of the data.